Mapping the Solar Panel Supply Chain is Key to Avoiding Forced Labor Risks

By Geraint John and Daniel Karns

Solar panels (and the solar panel supply chain) have an important role to play in the global transition to clean energy, but China’s use of forced labor to produce key components represents a tangible supply chain risk for U.S.-based companies.

Polysilicon – an essential material in the solar photovoltaic supply chain – is one of three items specifically targeted by the Uyghur Forced Labor Prevention Act (UFLPA), which took effect in June. It gives U.S. Customs and Border Protection (CBP) officers the right to detain imported products suspected of being made or partly made in the Xinjiang region of China.

A delayed and much-anticipated report on the situation in Xinjiang published in August by the UN High Commissioner for Human Rights accused China of “serious human rights violations” that “may constitute international crimes”.

As of the end of September – three months into implementation of the UFLPA – CBP commissioner Chris Magnus said that almost half of the 3,000-plus shipments detained by his agency were covered by the new law, with an estimated value of nearly $500 million. He didn’t specify the products affected, but several leading Chinese solar panel suppliers are reported to have had shipments detained or sent back.

Failing to comply with the UFLPA, knowingly or otherwise, presents serious financial, operational and reputational risks for American solar energy and other firms that need to be addressed.

China Continues to Dominate the Solar Supply Chain

Xinjiang, which is home to the predominantly Muslim ethnic minority Uyghur population, produces about 40% of the world’s supply of polysilicon, a high-purity grade of silicon mined from quartz. This is cast into ingots, which are then cut into wafers and used to make the solar cells that are, in turn, assembled into finished panels (modules).

Action by successive U.S. administrations over the past decade has largely halted the direct import of these products from China:

  • Starting in March 2012, the U.S. Department of Commerce imposed tariffs of up to 165% on Chinese solar cells and panels in an effort to stop the dumping of low-cost products into the U.S. market. These measures were ratified and extended in 2014, 2018 and in February of this year.
  • In June 2021, the U.S. Department of Labor added polysilicon from Xinjiang to its annually updated List of Goods Produced by Child Labor or Forced Labor. It joins nine other product groups thought to involve the use of forced labor in the region, including cotton, tomatoes, footwear and textiles.
  • Later that same month, the CBP issued a Withhold Release Order (WRO) against Hoshine Silicon Industry Co. Ltd, a Xinjiang-based firm accused of using intimidation, threats and restricted movement practices against its workforce. The WRO instructs U.S. port officers to detain shipments of silica-based products made by the company and its subsidiaries.

The U.S. Solar Panel Supply Chain

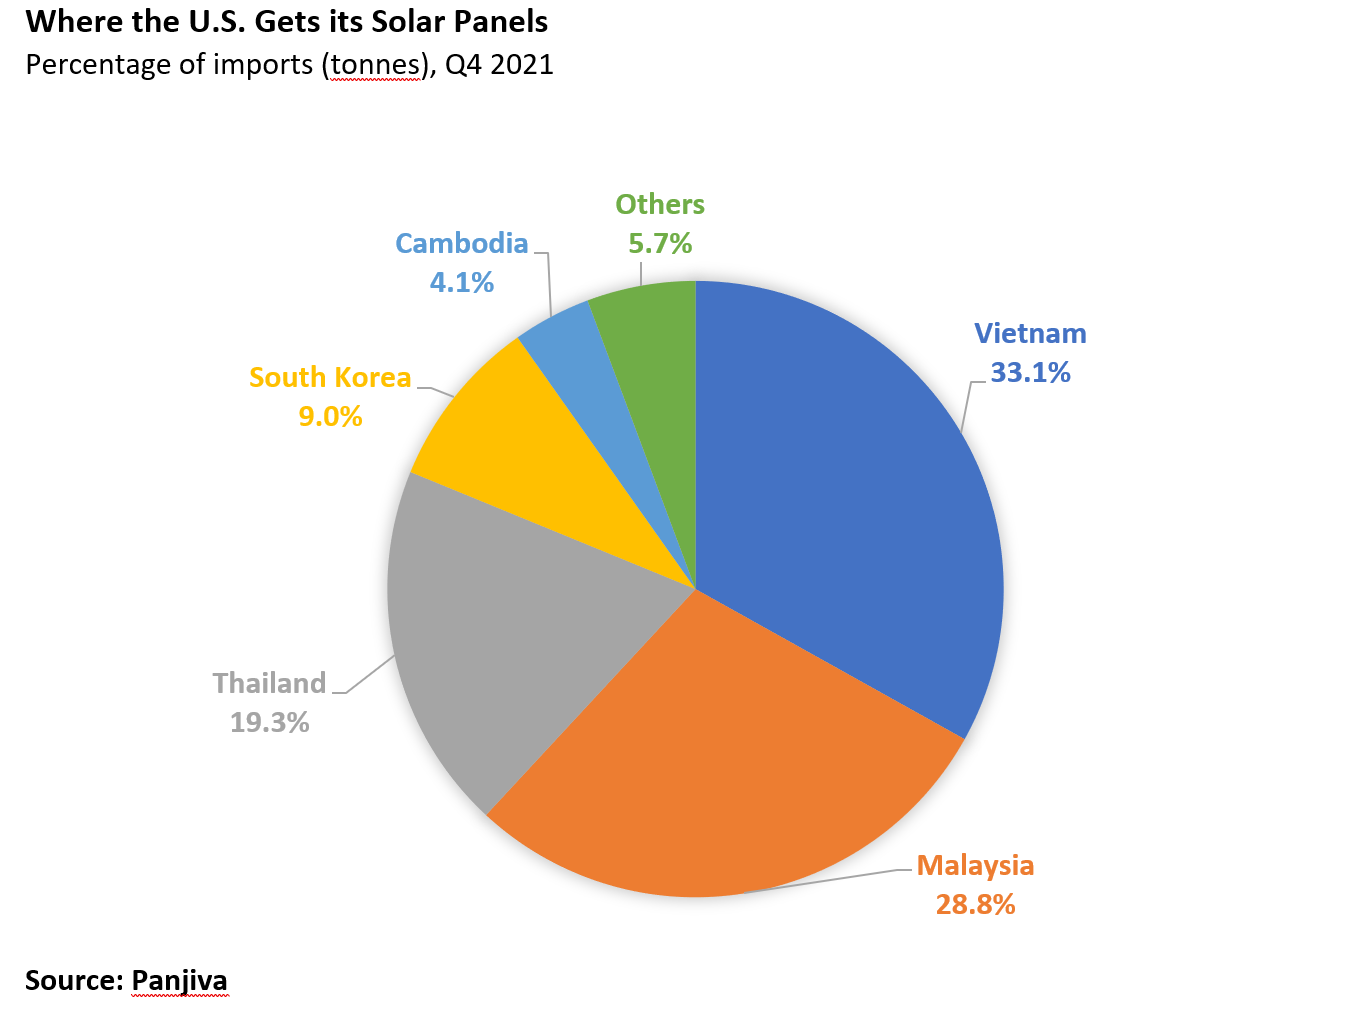
As a result of these actions, U.S. imports of solar panels now come mainly from other countries in Asia. In the final quarter of 2021, Vietnam, Malaysia and Thailand accounted for more than 80% of shipments (see chart).


Pie chart showing origins of US solar panel supplies. Vietnam, Malaysia, and Thailand are the top 3 countries, followed by S. Korea and Cambodia.

However, as with lithium-ion batteries, China dominates solar supply chains. Seven of the world’s 10 biggest solar panel makers are Chinese, and according to U.S. government agencies:

  • China owns 72% of global manufacturing capacity for polysilicon (with 54% of total output produced in Xinjiang).
  • In addition, China controls 98% of global manufacturing capacity for ingots, 97% for solar wafers, 81% for solar cells and 77% for solar panels.
  • Three-quarters of solar cells installed in the U.S. are made by subsidiaries of Chinese firms operating in Vietnam, Malaysia and Thailand, which import large quantities of solar materials from China.

An analysis of Interos’ global relationship platform data in August found:

  • 120 direct, tier-1 relationships between U.S. buyers and Chinese solar panel suppliers.
  • Almost 9,500 indirect, tier-2 relationships, with the vast majority accounted for by four suppliers: JinkoSolar Holding Co. Ltd; JA Solar Holdings Co. Ltd; Trina Solar Co. Ltd; and Suntech Power Holdings Co. Ltd.
  • Hoshine Silicon Industry Co. Ltd – the subject of last year’s WRO action – had just five direct relationships with U.S. buyers, but more than 160 tier-2 connections.

Guilty Until Proven Innocent

Unlike some previous supply chain-oriented legislation, the UFLPA puts on the onus on importers to demonstrate that solar products have not involved the use of forced labor.

In its guidance to importers, CBP notes that “imports of all goods, wares, articles, and merchandise mined, produced, or manufactured wholly or in part in the Xinjiang Uyghur Autonomous Region (Xinjiang) of the People’s Republic of China (PRC), or by entities identified by the U.S. government on the UFLPA Entity List, are presumed to be made with forced labor and are prohibited from entry into the United States.”

It continues: “The presumption also applies to goods made in, or shipped through, the PRC and other countries that include inputs made in Xinjiang.”

Mapping solar supply chains is therefore an essential foundation for companies to comply with the UFLPA. Speaking to Bloomberg earlier this month, AnnMarie Highsmith, an executive assistant commissioner at CBP, said companies needed tools to identify potential forced labor in their supply chains and avoid unwitting violations of the act.

A particular danger here is “supply chain washing” – where suppliers seek to avoid the UFLPA and other trade restrictions by routing raw materials, components and finished products tainted by forced labor through intermediary countries.

What can you do to safeguard your solar panel supply chain?

Alongside mapping and monitoring activities, CBP’s guidance document stipulates the following in relation to polysilicon:

  • “Importers need to provide complete records of transactions and supply chain documentation that demonstrate all entities involved in the manufacture, manipulation, or export of a particular good, and the country of origin of each material used in the production of the products going back to the suspected source of forced labor, i.e., production in Xinjiang or by an entity on the UFLPA Strategy entities lists.
  • “Provide a flow chart mapping each step in the procurement and production of all materials and identify the region where each material in the production originated (e.g., from location of the quartzite used to make polysilicon, to the location of manufacturing facilities producing polysilicon, to the location of facilities producing downstream goods used to make the imported good).
  • “Provide a list of all entities associated with each step of the production process, with citations denoting the business records used to identify each upstream party with whom the importer did not directly transact.
  • “Importers should be aware that imports of goods from factories that source polysilicon both from within Xinjiang and outside of Xinjiang risk being subject to detention, as it may be harder to verify that the supply chain is using only non-Xinjiang polysilicon and that the materials have not been replaced by or co-mingled with Xinjiang polysilicon at any point in the manufacturing process.”

CBP officials acknowledge that more staff are needed to fully monitor and enforce UFLPA requirements at U.S. ports of entry. But experience from its first quarter of operation suggests that companies cannot afford to be complacent about the act, which sets a new and higher bar for supply chain risk management.

US Government Adds New Supply Chain Restrictions on China, Russia, as Compliance Challenge Increases

By Andrea Little Limbago

Significant U.S. policy shifts toward technology exports to China have occurred over the last few weeks. By some accounts they are the biggest shifts in decades. Indicative of the growing implementation of prohibitions and restrictions, the U.S. has announced a steady drumbeat of export controls aimed at both crippling Chinese semiconductor manufacturing and fostering more secure and trusted technology ecosystems within U.S. supply chains.

While these latest restrictions are touted by some as unprecedented, they are not surprising. Instead, they are part of the growing trend we have detailed regarding the collision of economic warfare and compliance. Since 2016, the U.S. Department of Commerce’s Entity List alone has added over a thousand Chinese and Russian companies. Inclusion on the Entity List prohibits U.S. companies from purchasing goods and materials from that entity. There are dozens of other restriction lists as well, including those within the Departments of Commerce, Treasury, Defense, and State and Federal Communications Commission.

"Commerce Department Entity List Additions," measuring Chinese and Russian companies added to the list each month.

The Latest Wave of Restrictions: Semiconductors

The Biden Administration announced the most extensive technology restrictions on October 7th, aimed at limiting semiconductor materials shipped to China. The new restrictions expanded the scope of the Export Administration Restrictions (EAR) on 28 Chinese companies, the majority of which were already on the Entity List, adding a new license requirement and additional rules. These rules target U.S. national security concerns, and add certain advanced semiconductor technologies to the Commerce Control List (CCL) as well as rules pertaining to end-use controls and additional license requirements.

However, the new rules do not stop there. They also add 31 Chinese companies to Commerce Department’s Unverified List, a designation for companies “whose bona fides” have not been verified; that is, where U.S. officials have not completed site visits to establish whether they can be trusted with critical technologies. If the U.S. government is prevented from future site visits, these companies will then be escalated to the Entity List.

New Supply Chain Restrictions Also Focus on Russia

This latest round of restrictions announcements comes on the heels of three other announcements since late September. On September 20, the Federal Communications Commission (FCC) added China Unicom and PacNet/ComNet companies to its Covered List, referring to Section 2 of the 2019 Secure and Trusted Communications Networks Act. On September 30, Commerce added 57 additional Russian entities to the Entity List, bringing the total to well over 500 entities since Russia’s invasion of Ukraine in February. A few days later, on October 5, the Department of Defense updated Section 1260H of National Defense Authorization Act 2021. This update included over a dozen new Chinese companies identified as military companies operating in the United States. Two days later, President Biden announced the sweeping restrictions targeting the Chinese semiconductor industry.

These additions alone have a far-reaching impact. Over a third of Fortune 500 companies have had at least one of these new additions within the first tier of their supply chain. This more than doubles to almost 80% when looking at their tier 2 and tier 3 relationships. In short, this is a significant compliance risk that for some may be below the radar. Organizations should review their supply chains for these additions to assess their own risks.

Watch to see how to identify restrictions risks within the Interos platform. 

Industrial Policy, Collaboration, and a Reglobalized Economy

The United States is not alone in these latest restrictions. As Commerce’s Russian restrictions press release notes, 37 allies and partners have implemented similar controls. The European Union has issued its eighth tranche of Russian sanctions, this time targeting critical chemicals. Earlier this year, the European Union presented a new supply chain law targeting human rights violations in response to the growth of human rights violations, especially in China. The unprecedented implementation of these restrictions by the U.S., allies, and partners is introducing new compliance challenges and extremely difficult to stay on top of without significant effort.

But that effort is essential for resilience in the “new normal.” Geopolitically driven restrictions are splintering global supply chains along geopolitical fault lines, indicative of the core characteristics defining the emerging world order. As the Economist notes, a new macroeconomic era is underway. But it is more than that. The October 7 restrictions have already led to almost $9B in losses for Chinese semiconductor stocks and U.S. suppliers are halting business activities and pulling out staff in China. There likely will be some retaliation as China also has its own unreliable entity list and pursues the “Made in China 2025” agenda.

At Interos, we will continue monitoring the wide range of restrictions, their subsequent compliance challenges, and their role in the ongoing transformations reshaping globalization and supply chains.

The Next Hurricane Could Spell Supply Chain Disaster for Companies Without Operational Resilience

By Kate Anderson

Hurricane Ian has caused massive damage to physical infrastructure on the east coast last week, shutting ports and terminals, and further disrupting already-strained US supply chains. Unfortunately, these kinds of weather-related supply chain disruptions are likely to become increasingly frequent. In recent years, hurricane season has become both longer and more intense, with a greater proportion of storms expected to reach Category 4 and 5 levels. NOAA recently projected that 2022 will be yet another above-average hurricane season, with an ongoing La Niña compounding the effects of global warming to increase the duration, frequency, and severity of North Atlantic hurricanes.

Hurricane Ian had devastating local effects, costing private Florida insurance companies an estimated $63 billion in damages—the most costly storm in Florida history. But that is just the tip of the iceberg. In the past few years, marine traffic has shifted away from the beleaguered west coast to the east coast. Some of the largest ports and transportation centers in the country were forced to shut down in anticipation of the storm, delaying shipments. These closures reverberate through supply chains, affecting businesses throughout the US and world.

A proactive approach to supply chain management requires that we heed the warnings of past events like Hurricane Sandy and Ian, to better understand the impact that a single storm could have on U.S. imports. This raises the question: If a major hurricane shut down all ports and terminals from Florida to Virginia, what could we expect to see in terms of supply chain impact? Answering this question requires visibility not only into the ports along the southeastern seaboard, but also the ripple effects as those disruptions propagate through the rest of the system.

Theoretically, What’s the Worst Possible Hurricane Supply Chain Scenario?

Maritime transportation accounts for a majority of U.S. imports and exports, with ports in Georgia, South Carolina, and Virginia among the largest importers on the East Coast.

We explored the potential impact of a theoretical catastrophic tropical cyclone event by looking at what types of commodities and U.S. firms would be impacted if all marine ports in Florida, Georgia, South Carolina, North Carolina, and Virginia were closed due to the dangerous conditions and damage that would come as a result of a severe hurricane.

The goods coming through southeastern ports range widely. Mechanical components make up the largest fraction. Electrical components are also heavily represented. Medical equipment and supplies, including vaccines, also come through southeast ports in volume. Consumer goods such as clothing, food, cars and motorcycles, and other consumer durables would also be affected.

Over 40,000 different companies shipped goods into ports on the southeastern seaboard during hurricane season last year, many of them receiving hundreds of individual shipments. The largest direct effects are on manufacturing. The largest among these are the transportation industry (automotives, airplanes, trains, roads, etc.) and aerospace and defense. The electronics industry would also be heavily affected, with further disruptions to the flow of crucial electronic components that are already proving in short supply.

Hurricane-Driven Disruption Could Have Even Larger Supply Chain Impacts

However, these numbers only represent the initial impact of the port closures. The events of the last few years have taught us that indirect effects can be just as disruptive to operations. Even if your business does not directly import items through Florida ports, you should still anticipate delays in the coming months due to Hurricane Ian. The reason is simple: If your suppliers are missing their shipments, then they are unable to provide you with the items you need for your operations. These “ripple effects” will impact a much larger fraction of the US economy than even the original event.

Proprietary Interos data allows us to look at the ripple effect of a severe weather event. Ports in the states affected by our theoretical storm serve over 40,000 companies. But according to Interos data, disruptions to operations in those companies would affect a further 243,000 additional companies. The situation is even more dire when we consider businesses yet another step out. 522,000 businesses would be affected at that level.

Our data also enabled us to take a look at different kinds of goods passing through the various ports affected by our hypothetical storm. We can use this to see which industries would be most affected by this potential disaster. While the food and beverage, machinery, and automotive sectors would be hit hardest, the chart below also highlights how widespread and potentially diverse the impact of major port closures along the US southeast would be.

"Top Industries Directly Affected by Port Closures." Food and beverage ranks first, followed by machinery.

Hurricane Ian will scarcely be the last major storm to shut down US trade infrastructure. Natural disaster-driven supply chain disruption is likely to only increase in severity and duration over the coming years – these impacts are no longer a matter of “if,” they are a matter of “when.” Organizations need to start developing effective contingency plans and disaster-preparedness measures to survive and thrive in this new environment of perpetual disruption. Of course, the best defense towards any disruption is a diverse and resilient supply chain. Achieving supply chain resilience first requires understanding the entirety of your supply chain, and the vendors and risks within it.

To learn more about how Interos can help you create total supply chain visibility and build operational resilience, visit our procurement solutions page. If you’re looking to better-understand the real impacts of supply chain disruption, check out our animated and interactive annual survey.