A Super El Niño is developing and based on current El Niño-Southern Oscillation (ENSO) models, there’s a 96% chance it persists through the winter of 2026–27. That’s not a forecast to file away. For procurement teams, logistics managers, and risk officers, it’s a countdown.
What makes this cycle particularly sharp is the whiplash effect. Australia just came out of a multi-year La Niña wet period and is now heading directly into what could be a record drought.
Southeast Asian economies haven’t had time to recover from prior weather stress before the next one hits. And the southern US, already six years deep into a drought across the Southwest and Southern Plains, may not get the relief a wet winter could bring unless that rain comes with the kind of flooding that refills aquifers.
Where to Watch: The Five High-Risk Geographies
Australia is the clearest near-term risk. Iron ore, coal, and agricultural commodities run through infrastructure that a serious drought season can disrupt from the ground up. Bushfire risk climbs through their spring (September–November), and the worst impacts historically land in their summer (December through February). If you source anything from eastern Australia, the time to model contingencies is now, not after the fires start.
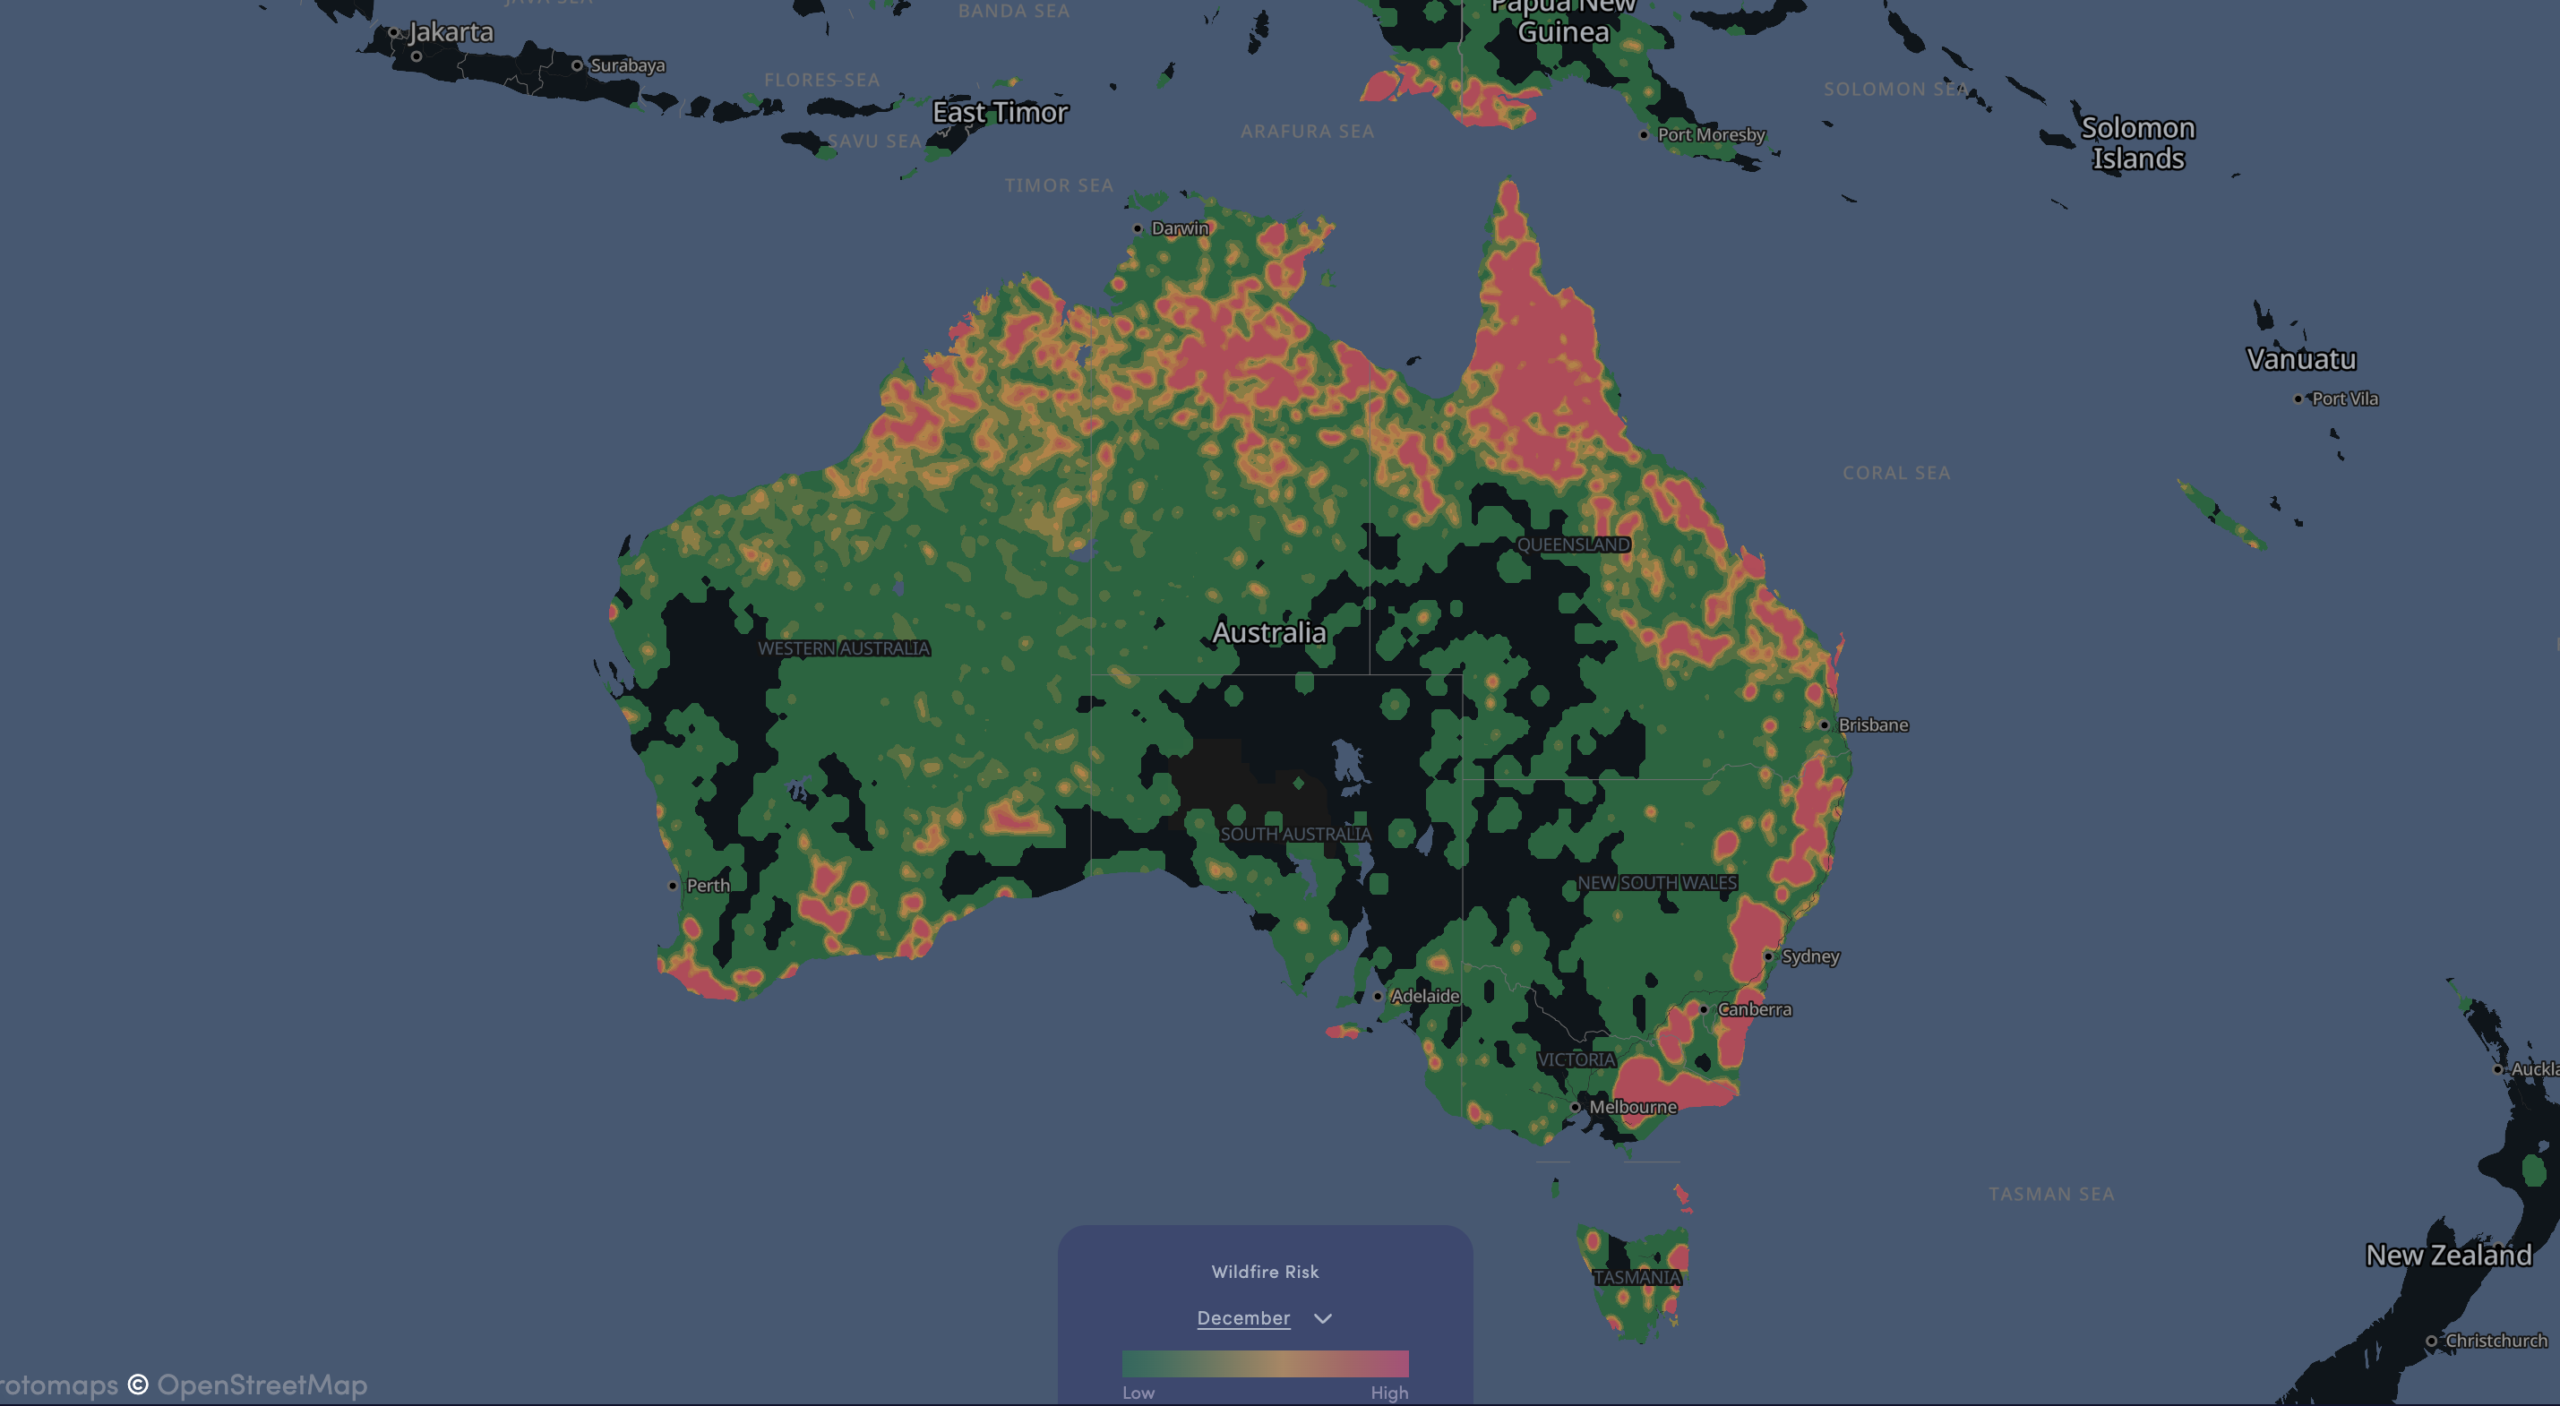
El Niño hazards will compound on top of existing baseline risks. Even in normal years, December produces high wildfire risk in Australia.
India is the most consequential wildcard. Monsoon season runs June through September, and a strong El Niño is the single biggest threat to it. Rainfall running 10–20% below normal across a population of 1.4 billion creates cascading effects well beyond agriculture. Water supply, energy production and consumer spending all take hits. India’s export profile includes petroleum, diamonds, pharmaceuticals, and apparel. A weakened monsoon doesn’t just hurt crops; it strains the entire economic ecosystem.
Indonesia and the Philippines are heading into a severe drought and fire season. The 2015 El Niño triggered an environmental and public health emergency in Indonesia as peat fires spread across degraded forest land. Palm oil, coal, copper, and electronics all flow out of this region. Smoke events alone can shut down ports and delay shipments for weeks.
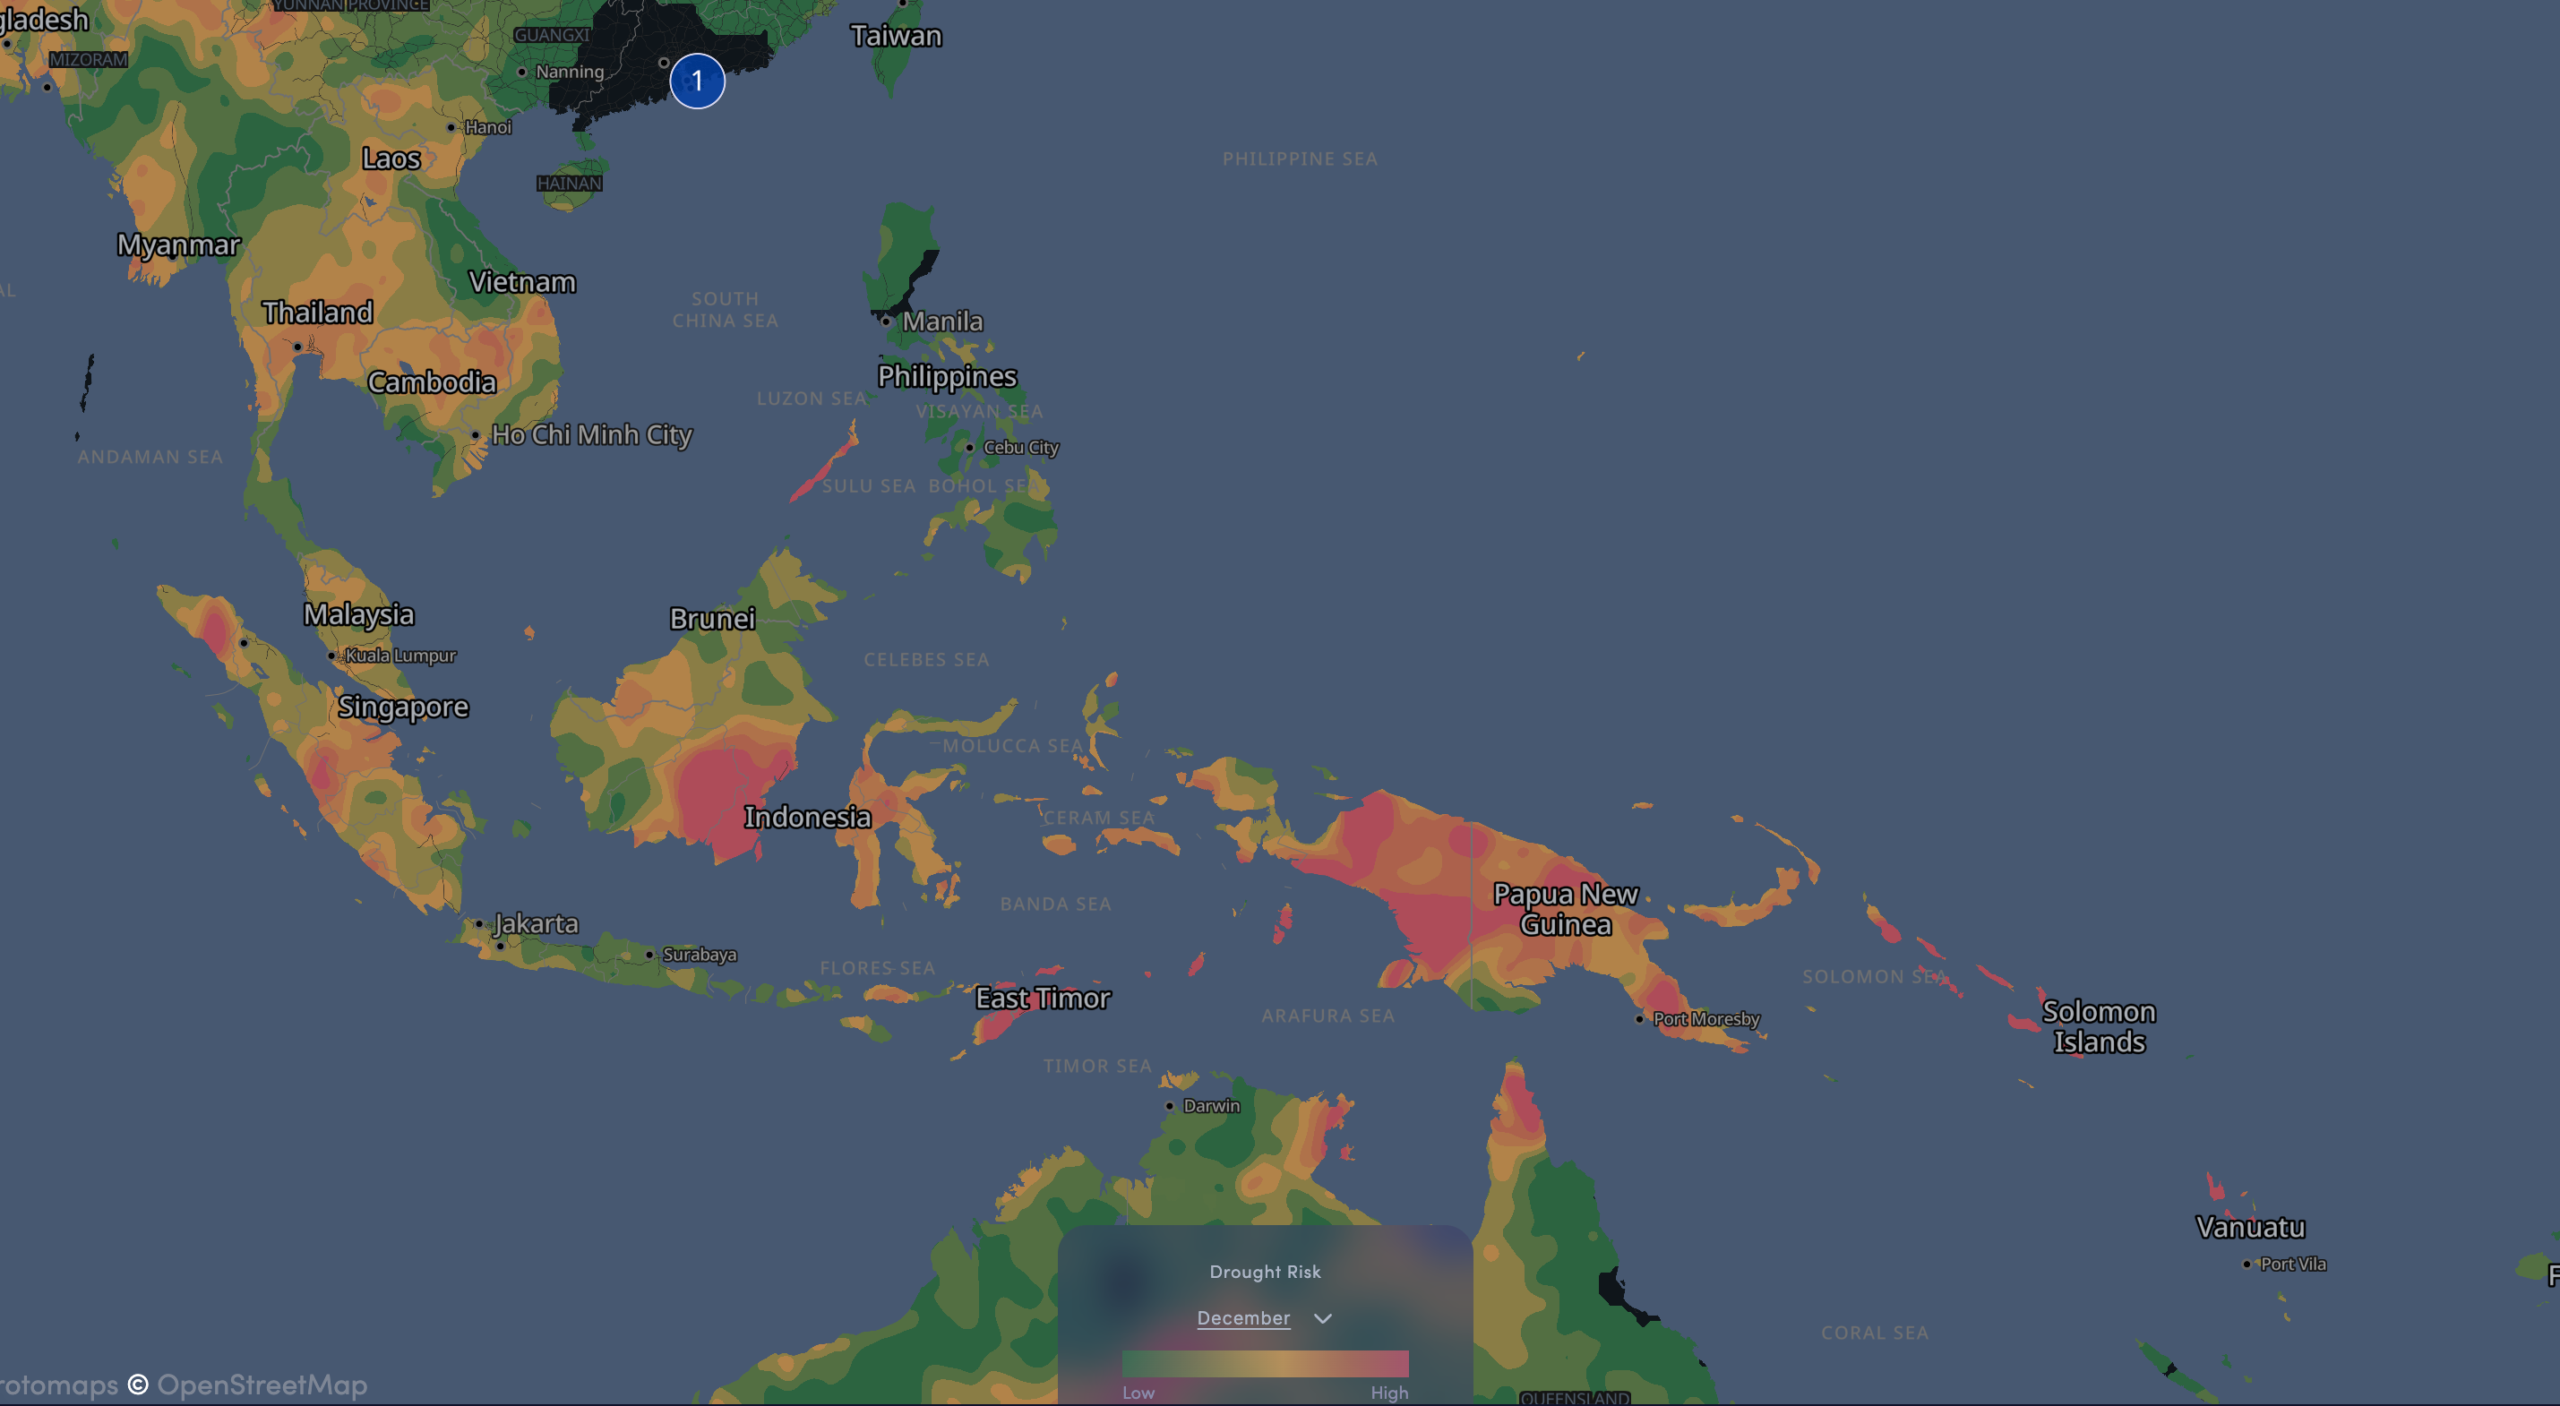
Even in non-El Niño years, drought risk in Indonesia and southeast Asia runs high in December. With a Super El Niño on the horizon, we expect intense droughts and fires in the region this winter.
Peru and Ecuador have a different problem: flooding. The Pacific coast of South America is where El Niño’s warming effect is most direct, and the historical record, particularly 1997–98 — shows catastrophic landslides and infrastructure destruction. Copper, shellfish, and petroleum all move through ports and roads that become vulnerable by late 2026 into early 2027.
The US Gulf Coast and Southern California are the winter story. A strong El Niño typically delivers heavy rain and flooding to the southern US, which sounds like good news given the
drought, but flash flooding and infrastructure damage aren’t the same as a managed recovery. California should also expect the marine ecosystem disruptions it saw in 2015: reduced cold-water upwelling, fish population shifts, and coastal instability that affects port operations.
While these five regions are some of the most characteristic and consequential during an El Niño, there are many others likely to be impacted by a severe event. In China, for example, an El Niño could lead to increased rain and flooding in southern China (south of the Yangtze River) and drought in the north, stressing agriculture, hydropower, and infrastructure across the country with rippling effects on global manufacturing.
What the Seasonal Calendar Actually Looks Like
Now through November: The Atlantic hurricane season gets quieter. El Niño suppresses storm formation significantly, with roughly a 60% reduction in hurricane days historically. That’s
generally good news for the eastern US and Gulf Coast logistics infrastructure. However, while there may be fewer hurricanes this year, one big storm that makes landfall can still be devastating. With warmer and warmer oceans each year, a severe hurricane is still a very real possibility. In the Eastern Pacific, though, we have the opposite story. Mexico, Hawaii, and the US Southwest face elevated hurricane risk. The 2015 El Niño produced 16 Pacific hurricanes and a record-breaking three simultaneous Category 4 storms near Hawaii. Meanwhile, drought stress begins building in India, Australia, Southeast Asia, and parts of sub-Saharan Africa.
Wildfire conditions in the Pacific Northwest are already elevated given a low snowpack year.
December through February: This is when El Niño’s full weight lands. Australian drought and fires peak. Southern Africa — Zimbabwe, Zambia, Mozambique, South Africa — droughts
produce food security crises. Peru and Ecuador face flooding and landslides. The southern US and California get heavy rain. The northern US and Canada run warm. Europe tends to run cooler than average, though forecasting precision there is lower. One thing worth keeping in mind: stronger El Niño events increase the certainty of these patterns, not necessarily their severity. A Super El Niño doesn’t guarantee the worst outcome in every region — it narrows the range of likely outcomes and makes the directional risks more reliable to plan around.
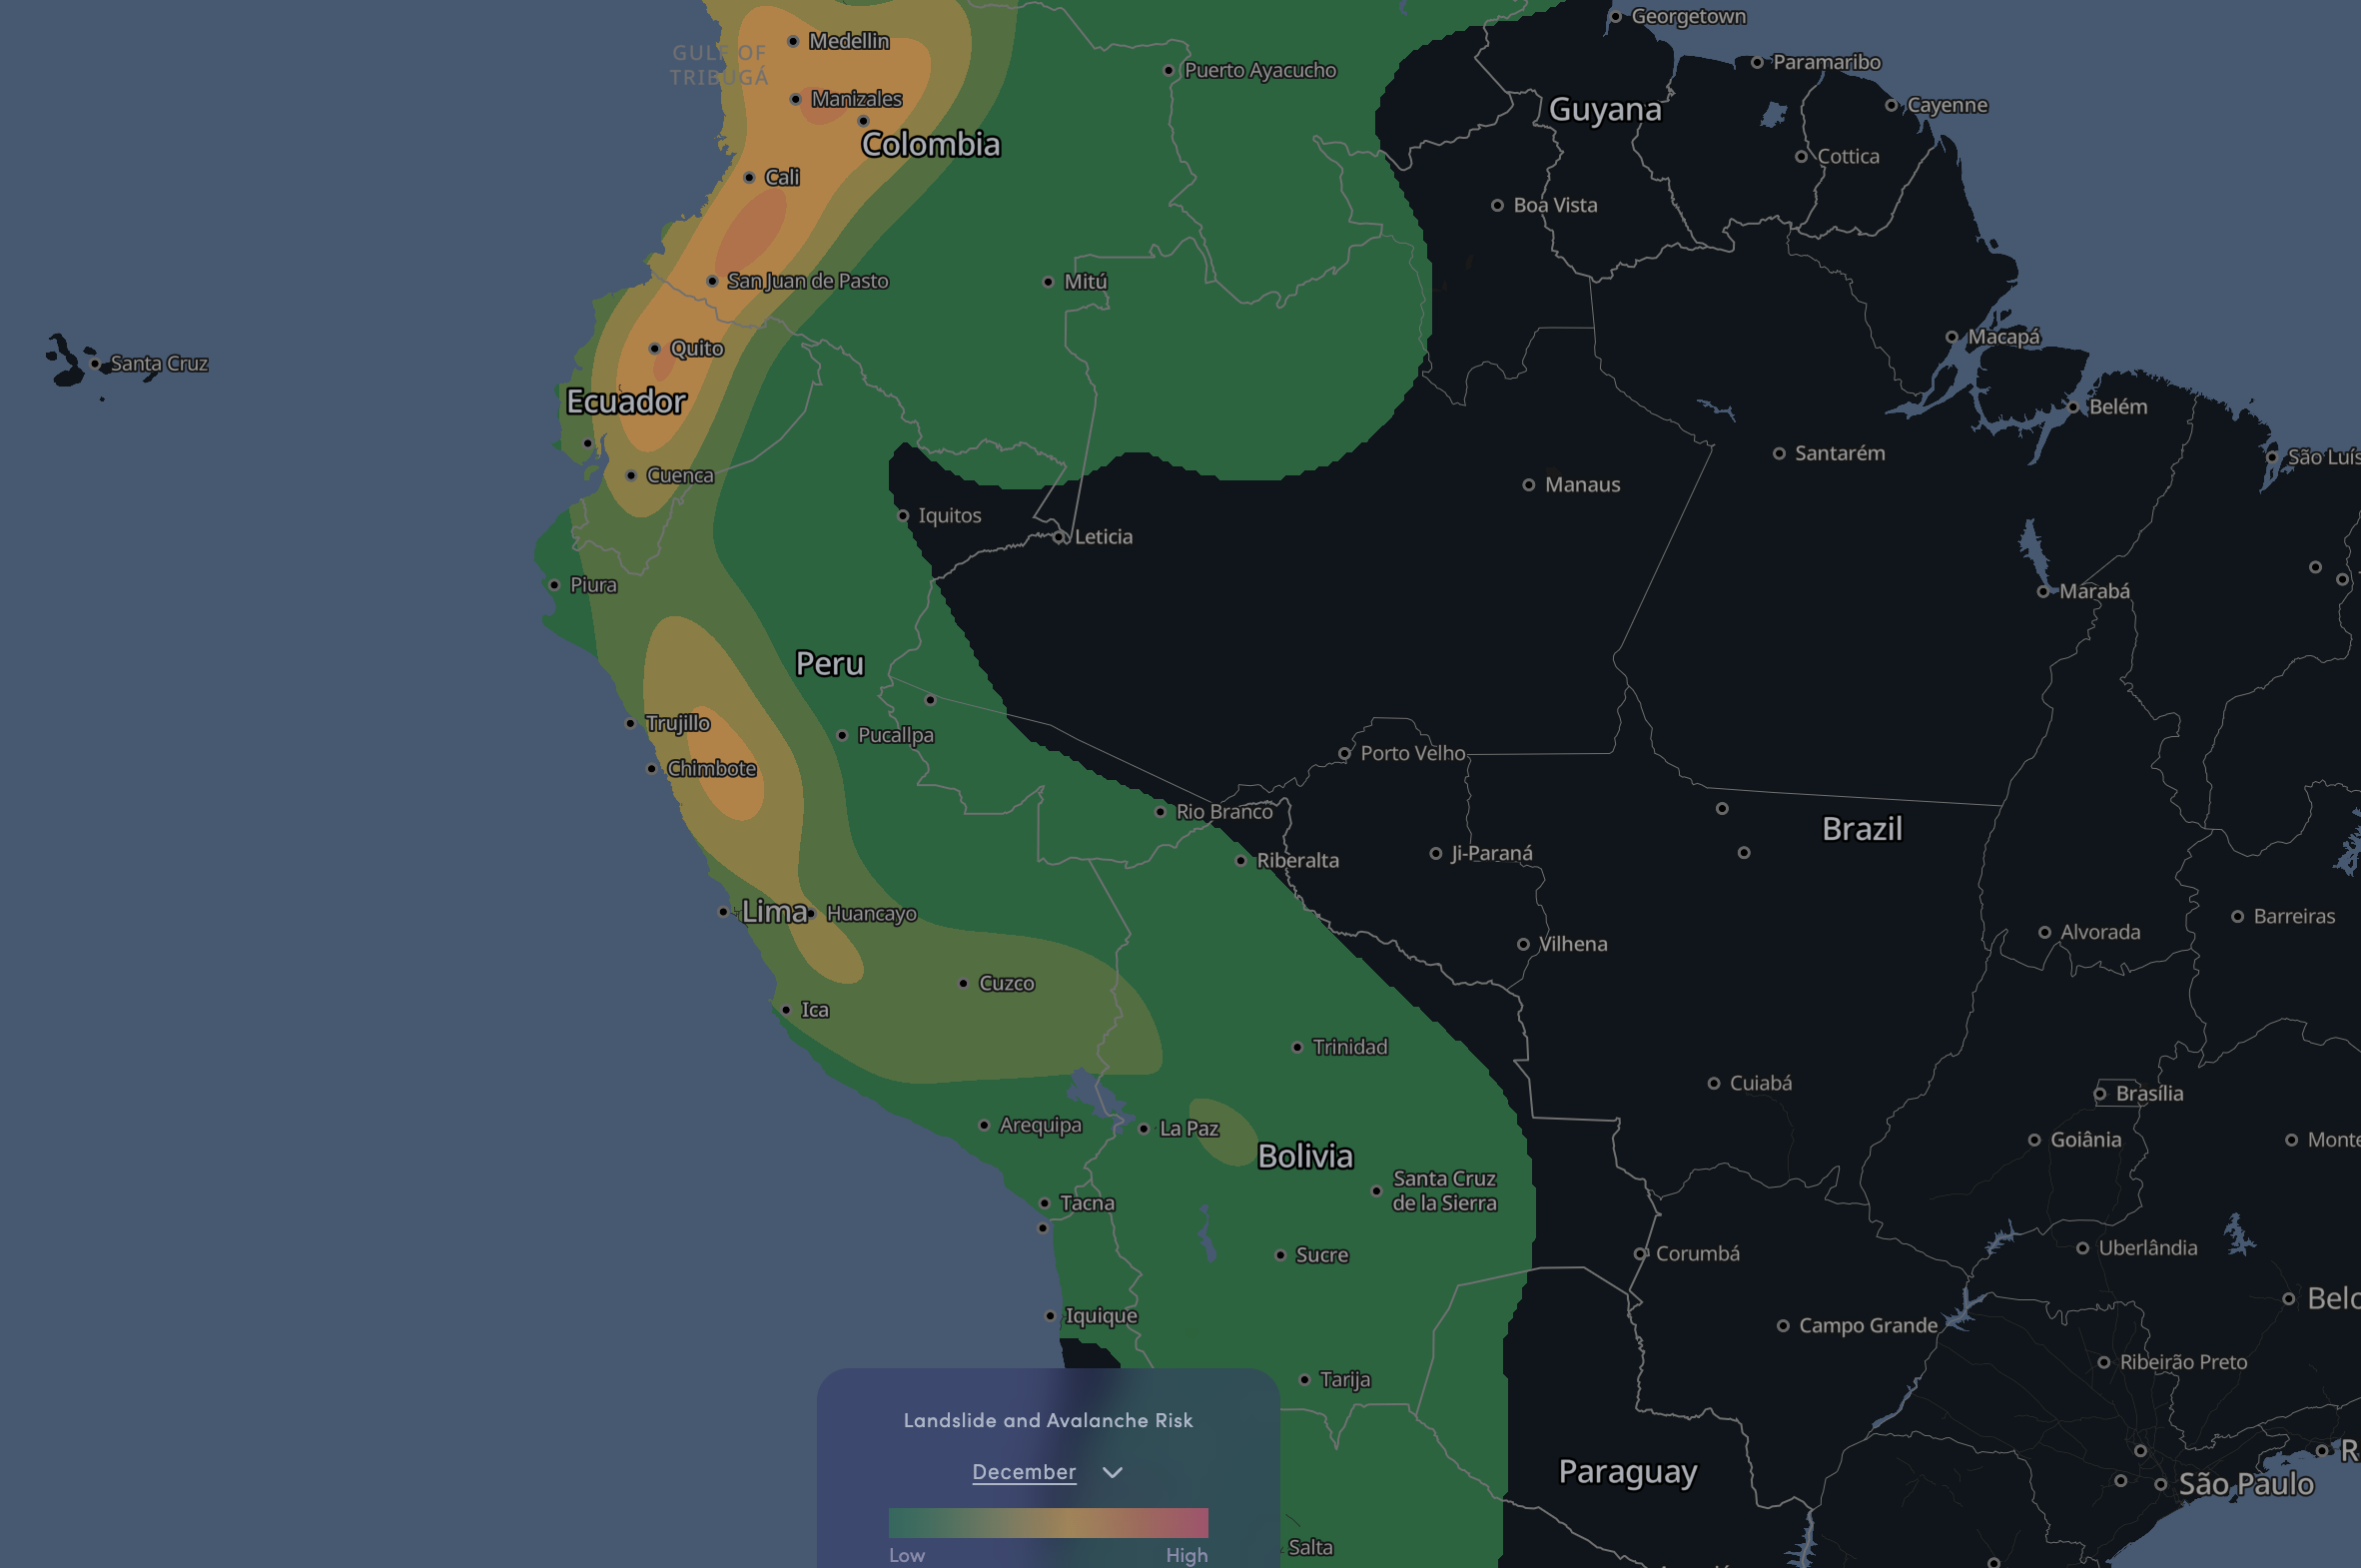
El Niño’s were first discovered and defined by the effects on Peru and Ecuador (warm ocean + torrential rain). With existing landslide risks in the region, there is an increased likelihood of extreme rainfall and landslides this winter.
One thing worth keeping in mind: stronger El Niño events increase the certainty of these patterns, not necessarily their severity. A Super El Niño doesn’t guarantee the worst outcome in every region — it narrows the range of likely outcomes and makes the directional risks more reliable to plan around.
The Supply Chain Implications Go Beyond Weather
El Niño’s effects on marine ecosystems are worth separate attention. Reduced cold-water upwelling in the Eastern Pacific disrupts fisheries, damages coral systems, and causes large fish
population migrations. For companies sourcing seafood or operating near Pacific coastal ports this isn’t a background fact. It directly affects supply volumes and port activity patterns.
There’s also a global temperature dimension. Global average temperatures will likely break records, though land-level effects vary. India, Southeast Asia, South America, and parts of Africa
run warmer. The US, interestingly, sees relatively modest temperature changes — even slightly cooler in some areas. But the energy demand implications for the regions that do run hot are significant.
The carbon story matters too. El Niño events historically expand global drought areas, reduce plant carbon uptake, and accelerate tropical forest fires, all of which push atmospheric CO₂ higher. For companies with emissions reporting obligations or carbon-intensive supply chains, this is part of the operating context.
What This Means for Risk Management
The 1997–98 El Niño caused over 22,000 deaths and $36 billion in global damages. The 2015–16 event rewrote records across multiple categories.
For supply chain risk, the playbook isn’t complicated, but it requires acting before the events materialize, not after:
Map your exposure to the five high-risk geographies. If critical suppliers, logistics nodes, or manufacturing facilities sit in Australia, India, Southeast Asia, South America, or the southern
US, model what a 10–30% disruption to those nodes looks like. Identify alternative sources and routes before you need them. Build inventory buffers on commodities with concentrated geographic exposure. And watch the marine ecosystem signals like port disruptions and fishery shortfalls tend to give early warning before the broader headlines arrive.
The models are telling us this event is coming. The uncertainty now is in the magnitude, not the direction.
interos.ai provides continuous supply chain risk monitoring across tier-1 through n-tier suppliers, including real-time climate and operational risk signals. Learn more at interos.ai.