Photo: Dori, CC BY-SA 3.0 US, via Wikimedia Commons
By Andrea Little Limbago & Julia Hazel
Increasing ESG (Environmental, Social, and Governance) mandates are resetting corporate agendas and exposing fault lines across businesses that lack an aligned response. While Chief Supply Chain Officers (CSCO) have relegated sustainability to the sidelines, a seismic shift has occurred elsewhere in the C-suite, with CFOs, who have catapulted ESG to the top of their priorities.
A recent survey in March 2024 demonstrated that CFOs ranked sustainability as their first priority, a departure from a July 2023 Gartner report, which found that two-thirds of CSCOs deprioritize it. In Interos’ own 2023 annual survey, executives estimated ESG-related cost increases or revenue losses companies at $44M annually. More than a third of respondents reported stepping up their ESG investments, and over half acknowledged that supply availability was paramount. Given the fluid and dynamic regulatory landscape, ESG disruptions can quickly become a near-term risk, leaving many companies ill-prepared for compliance or reputational or financial risk.
ESG is also a hot button issue in the United States, with some states expanding ESG-related regulations even as others introduce anti-ESG regulation. Despite this disconnect, stakeholder demands and regulatory reporting requirements are clearly not going away.
The E.U. Supply Chain Act and Germany’s Supply Chain Due Diligence Act are a case in point. The European Parliament just passed the proposed Corporate Sustainability Due Diligence directive (CSDDD) this week. The law, which heads to a final vote set for next month, requires large companies to disclose environmental damage or forced labor in their supply chains.
The German regulation took effect in January 2023 and includes disclosure of both human rights and environmental impacts across their supply chains. first actions have already been filed against several global corporations for failures to ensure worker safety in Bangladesh.
Overcoming “Aggregate Confusion”
Whether a company is taking the first steps toward ESG resilience or looking to strengthen existing efforts, the ESG regulatory landscape is a moving target. There are no common data standards to drive a clear, consistent, and effective strategy within organizations. This leads to divergent assessments, frustration for those attempting to prepare for the upcoming compliance wave, and simply, “aggregate confusion” with regards to ESG data. Fortunately, ESG data is improving. There are growing opportunities for organizations to assess supply chains with transparent, traceable, and verified data, which in turn enhances a company’s capacity for compliance and minimizing reputational risk.
The Regulatory Landscape: Conflict and Conceptual Stretching
The conflicting and vague nature of many ESG-related regulations or advisories are contributing to the gap between risk and action. For instance, climate-related risks are often bundled together under a single umbrella – or in conflict with one another – making it difficult for companies to discern and create appropriate response strategies. Both the European Union’s CSDDD), as well as California’s climate disclosure bill SB 253, include extensive Scope 3 disclosure requirements.
In contrast, the recent Securities and Exchange Commission (SEC) climate risk disclosures do not include Scope 3 requirements. The SEC climate risk disclosure focuses on the environment, requiring companies to disclose natural hazards risks, such as expenditures resulting from severe weather events, Scope 1 and 2 emissions, as well as climate-related targets and goals. However, grouping these disclosures under one umbrella creates additional confusion. Distinct corporate strategies are required to address risks related to climate resilience versus actions to mitigate a company’s environmental impact.
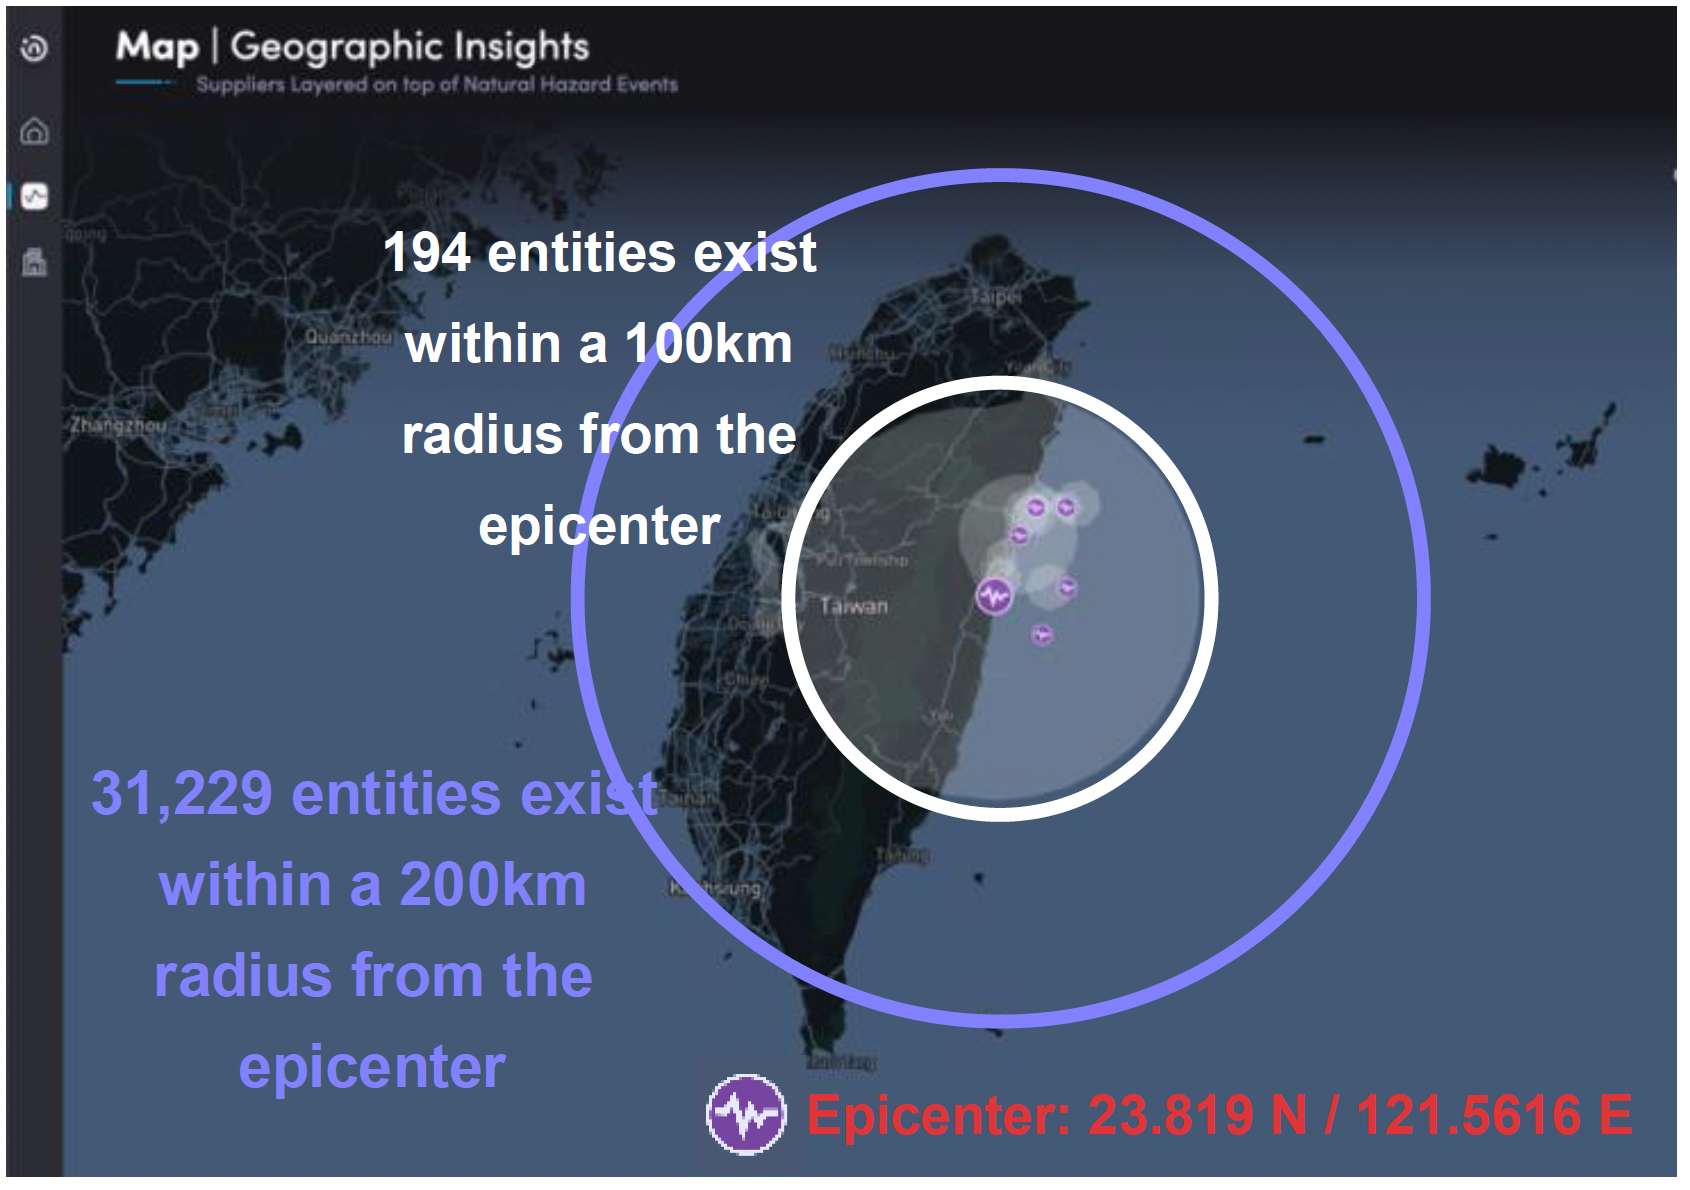
On the one hand, actions to ensure climate resilience focus on the impact that climate change has on a company’s global footprint and operations. Interos previously discussed these kinds of catastrophic risks and how companies can use continuous risk intelligence to pre-empt disruption. On the other hand, a company’s impact on the environment relates to fast-changing environment, social, and governance (ESG) regulations.
Broadly, the difference comes down to compliance and reputational risks compared to physical (even existential) continuity risks, with financial risks common across both. Each of these provides two distinct, but interconnected risks associated with sustainability that require different organizational strategies and preparation. While the data and science behind natural hazard risk has a long and robust history and validation, the same is not true in the ESG space.
The Data Challenge
MIT’s Aggregate Confusion Project highlights the ESG data problem by noting that the correlation among major ESG ratings agencies is only .54. By comparison, financial ratings agencies have credit ratings correlated at .92. The poor correlation between ESG ratings agencies has wide repercussions. The same company could be scored highly by one agency and poorly by another, making it both difficult to prove compliance while also opening the aperture for misuse of the scores.
Interos has assessed many of the most prominent ESG ratings vendors with a focus on transparency, traceability, and external validation. The data is created through one of two opposing methods – surveys or machine-learning web scraping. Those that focus on surveys provide extremely comprehensive data with understandably low coverage, but they also lack validation and often enable self-scoring and attestation. Conversely, machine learning data collection has extensive coverage, but is extremely shallow in data depth and quality. A single news article, for example, may be the basis of an entire score.
Towards a New ESG Model
Interos developed a new ESG model with data that allows for the transparency and traceability lacking in the ESG space. The model was developed in partnership with ESG data and technology leader ESG Book. As a global leader in sustainability data and data transparency, the company operates a corporate disclosure platform to facilitate ESG disclosures and help organizations map these disclosures to leading global frameworks. Interos’ expanded ESG risk model provides raw metrics that cover a range of ESG topics: Scope 1, 2, and 3 emissions, forced labor and human rights policies, supplier oversight and product safety, and more.
In addition to ESG Book, Interos has integrated its own critical restrictions risk and corporate ownership structure data into its enhanced ESG model. This enables the platform to connect specific human-rights related restrictions, such as UFLPA and companies operating within the Xinjiang Uyghur Autonomous Region, as components of social risk models. The company also leveraged Interos proprietary ownership data to create a new government intervention risk based on Interos’ unique combination of ownership control and government ties. Risk managers that need to monitor governance risk must consider the growing global risk of government intervention into the private sector, one of many necessary steps required to surface vital information to get in front of risks and prevent supply shocks.
Charting the ESG Future for Competitive Edge
Forward-leaning organizations are adapting their risk frameworks to integrate ESG, integrating environmental and social sustainability into corporate strategies designed to embed critical supply chain risk intelligence throughout the enterprise. Regulations emerging from Europe will have a global impact beyond their borders. As with the General Data Protection Regulation (GDPR), European laws will directly impact global companies with operations in affected geographies.
Leading organizations are urgently responding to risks associated with the shifting regulatory and reputational ESG landscape. This requires leaning into sustainability risks and opportunities, instead of away from them, especially during strategic trade-off discussions. Organizations can leverage advanced visibility and continuous risk intelligence to transform ESG vulnerabilities into competitive advantage.
A proactive ESG risk posture furthers confidence among critical stakeholders who view ethical and compliant supply chains as foundational to responsible commerce. The path forward begins with mapping and monitoring sub-tier ESG threats. Interos is excited for this next stage in ESG risk assessments and helping businesses embed resilience across their enterprise.